The September Barcode: Beyond the 'Panic-Purchase' Mindset
Image credit: Sensibill
The Barcode Report delivers the world’s deepest and most relevant insights on everyday consumer spending. We break down spend data into digestible and actionable facts, highlighting key trends that go beyond what you’d learn from simple card statements. We leverage item-level receipt data accumulated from millions of users across our network of banks, credit unions and technology partners. The Barcode dives beneath the surface of “how much was spent and where” and provides a true look at what consumers and small businesses are spending their money on.
In this report, we’re focusing on ‘panic purchases’ from the last year.
Key Highlights & Takeaways
Toilet Paper Indicator ranked number 1 in predicting “panic-purchase” behaviour.
The toilet paper indicator is one of the key indicators that signal “panic-purchase” pandemic behaviour. This indicator went up 9 places and ranked number 1 at the onset of the pandemic.
75% of the time, online search trends support preceding average consumer spend trends.
Online search trends, when coupled with consumer spend trends from SKU-level data, increases the accuracy in predicting future consumer demand trends.
Consumer spend in toilet paper expected to decrease by 10% in the next quarter.
Despite new stories of increase in demand for toilet paper, it does not look like this is as pervasive and we predict that there won’t be any surges in the next quarter.
Toilet Paper is a key indicator of the “crisis-purchase” pandemic mindset
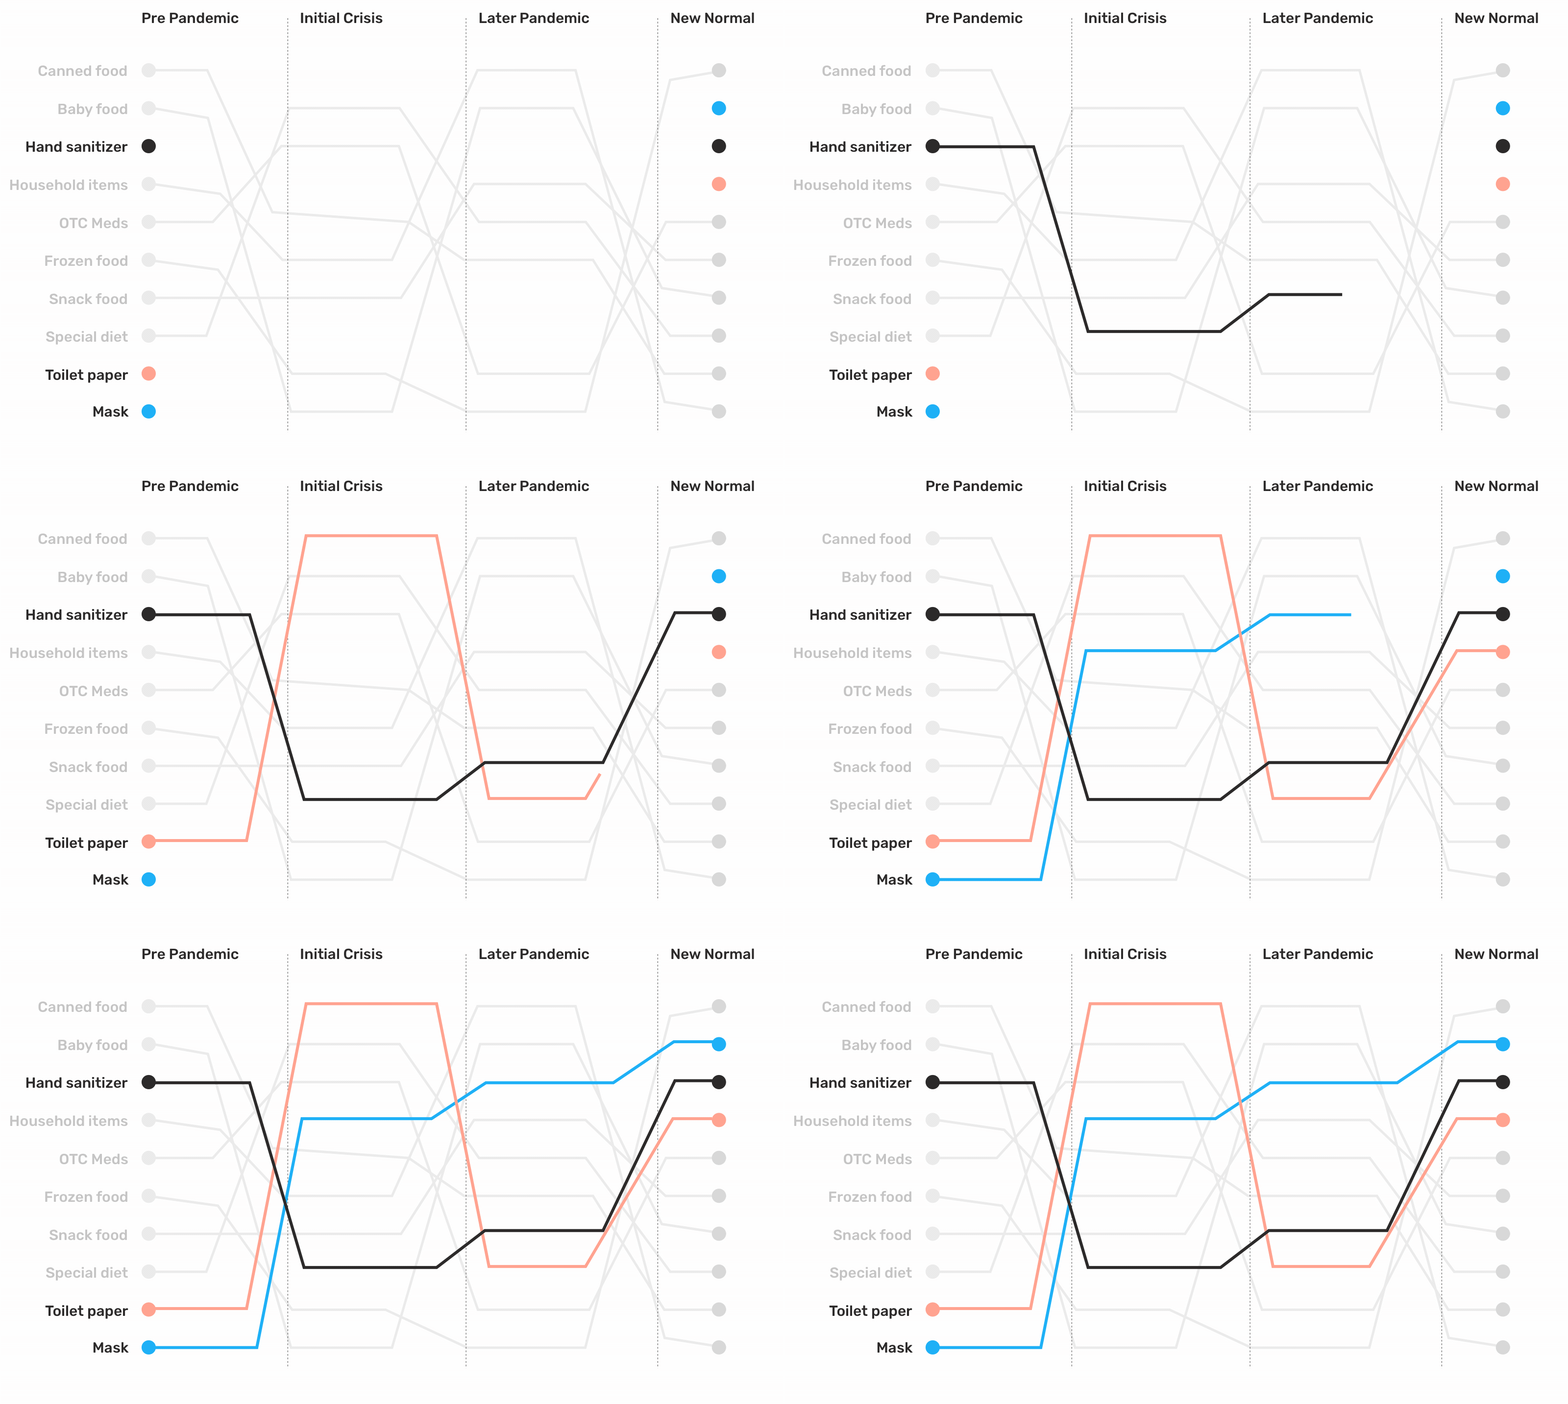
Consumer spend behaviour has shifted immensely in the past year and a half and continues to morph as the pandemic prolongs. When we looked at SKU-level data in our receipts, average consumer spend in the toilet paper category is a key indicator in defining the “crisis-purchase” consumer behaviour. This indicator went up 9 places during the initial crisis of the pandemic (March 2020 - June 2020). This indicator dropped drastically during July 2020 to March 2021 timeframe, only to go up to rank 4 as new lockdown measures continue to be imposed with rising infection rates.
Hand Sanitizer Purchases indicating return to a “new-normal”
We are all aware of the brief moments of shortage of hand sanitizers during the initial crisis of the pandemic. When we delved into the SKU-level data in our receipts, we found that hand sanitizer purchases, which had been ranked at position 3 during the pre-pandemic era, dropped to the 8th position during the initial crisis of the pandemic. This indicator has since been rising indicating and currently sits in 3rd position indicating a recovery from the earlier supply-shortage.
Image credit: Sensibill Data Lab
Online search trends support preceding consumer spend trends identified from SKU level data
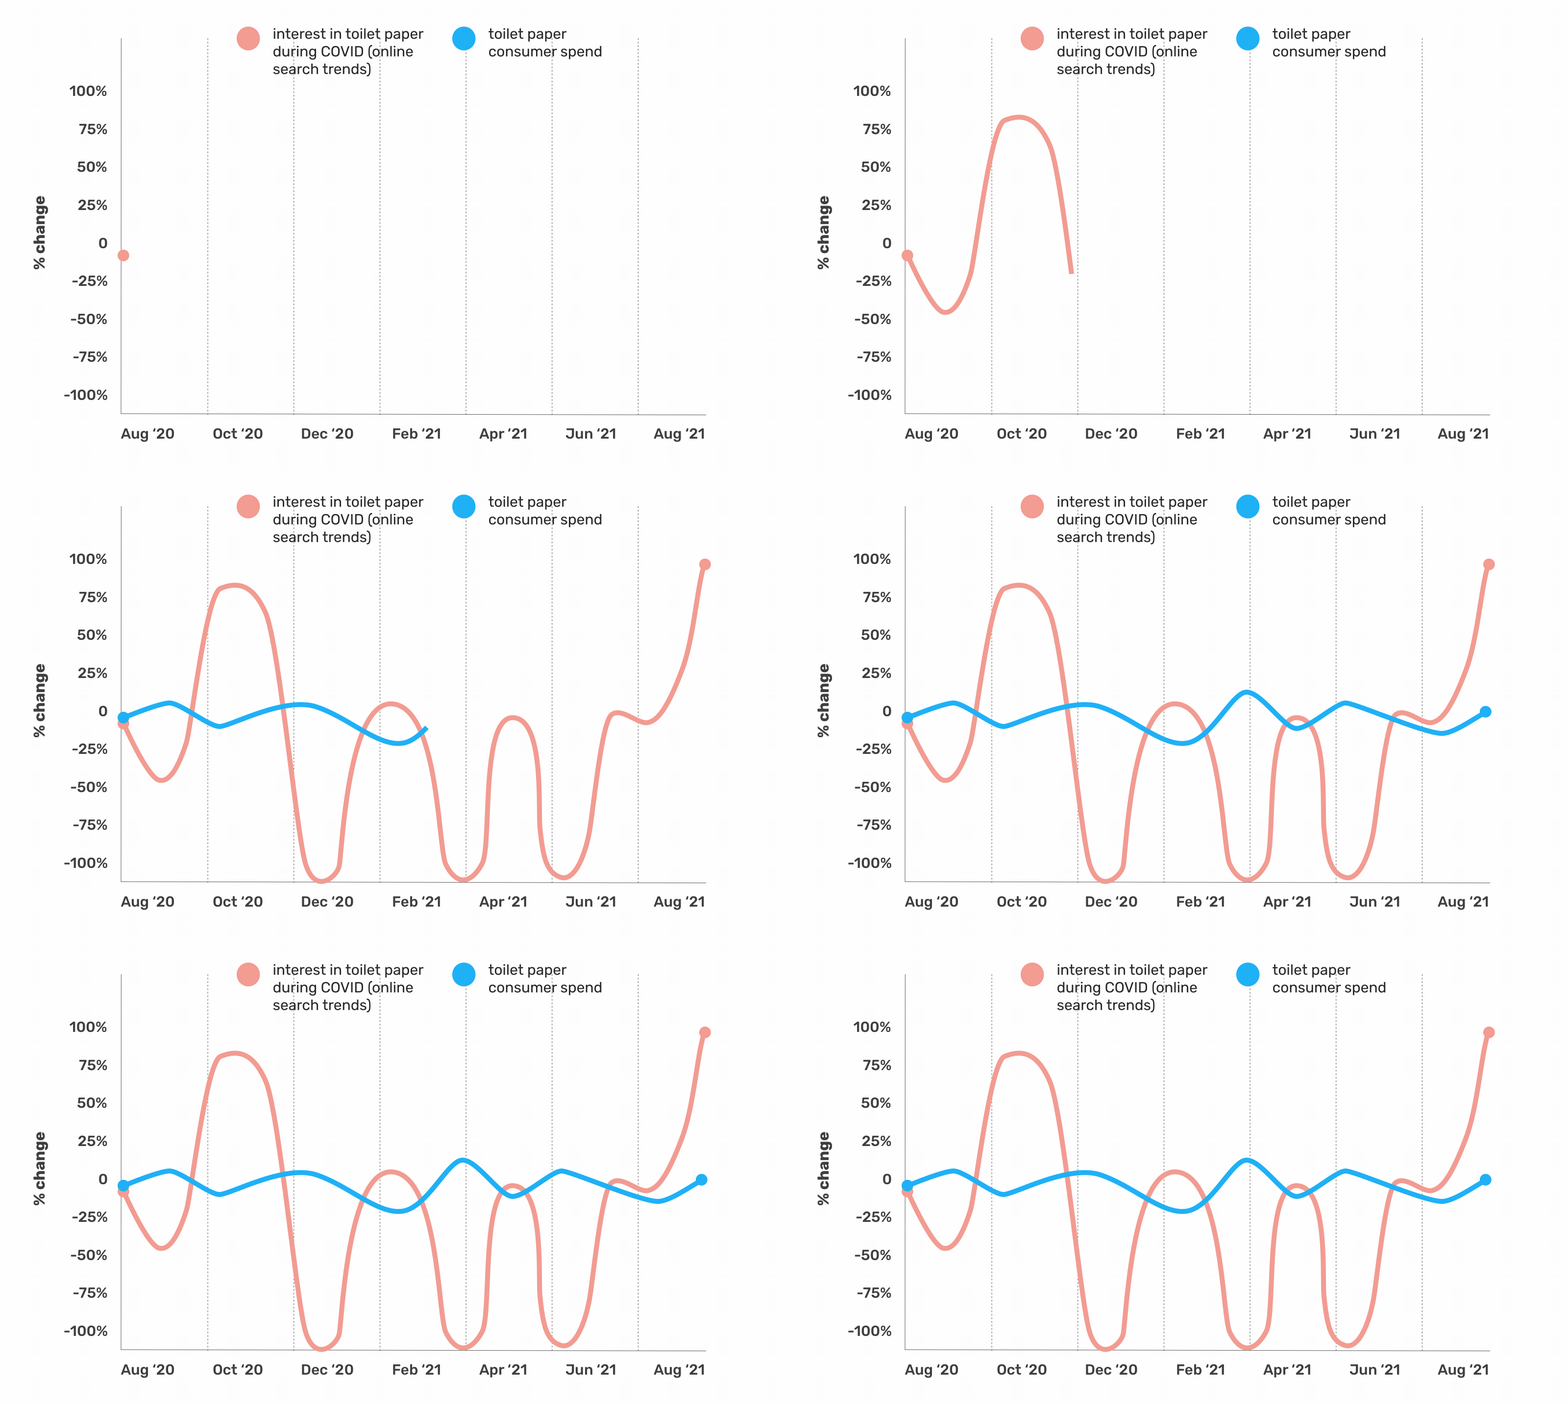
While online search trends are a great indicator of consumer behaviour, when we overlaid this information with the SKU-level data from our receipts, we found that online searches for toilet paper during the pandemic follow consumer spend in this category. Out of the 12 months analysed, 75% of the time, online search trends have supported the average consumer spend in preceding months. On average, a change in average consumer spend on toilet paper is followed by an average change in online search trends which is 6 to 7 times more amplified. In September 2020, the average consumer spend on toilet paper increased by approximately 9%, which was followed by an 80% increase in online searches in October 2020. This indicates that by combining online search trends with SKU-level data from our receipts, we are able to predict more accurate consumer demand trends.
Image credit: Sensibill Data Lab
Consumers are embracing the pandemic and moving away from panic-purchases!
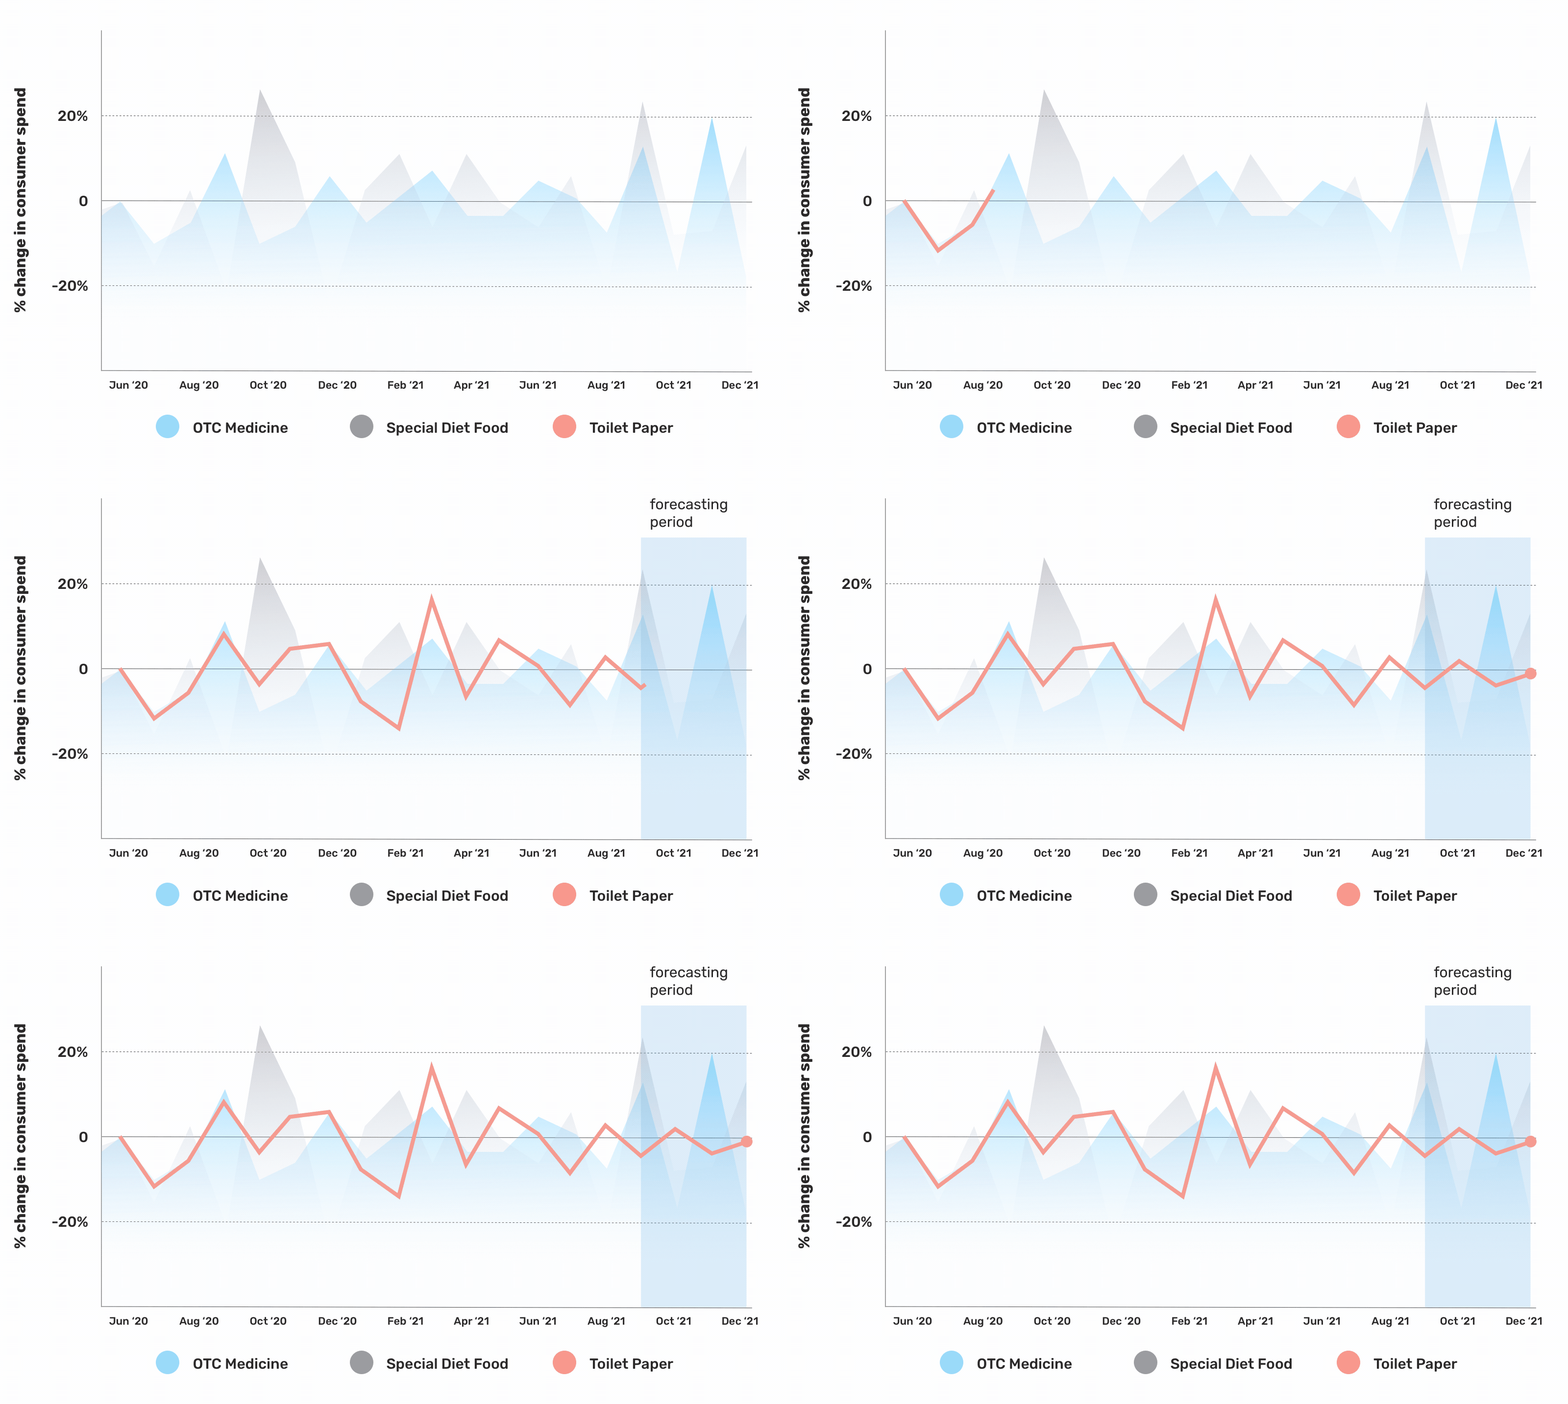
Looking ahead, we used the “panic-purchase” consumer behaviour signals from the initial crisis period of the pandemic to predict if a similar behaviour will be seen in the future. While the toilet paper purchase sky-rocketed during the onset of Spring 2021, however, this trend is not pervasive. Based on our prediction models, the average consumer spend on toilet paper is expected to decrease at an approximate monthly rate of 10% in the next quarter.
Image credit: Sensibill Data Lab
P.s. Subscribe here to get the report to your inbox every month ✅


