
The March Barcode: Consumer grocery shopping mid-pandemic

Image credit: Sensibill
The Barcode Report delivers the world’s deepest and most relevant insights on everyday consumer spending. We break down spend data into digestible and actionable facts, highlighting key trends that go beyond what you’d learn from simple card statements. We leverage item-level receipt data accumulated from millions of users across our network of banks, credit unions, and technology partners. The Barcode dives beneath the surface of “how much was spent and where” and provides a true look at what consumers and small businesses are spending their money on.
In this report, we’re focussing on the shift in food spending in the wake of the pandemic and resulting lockdowns in 2020, and how today’s spending differs from pre-pandemic behavior.
Key Highlights & Takeaways
Although spending overall at restaurants slowed, spend tracking at fast food restaurants grew by 83% from the previous year.
There was an initial surge in grocery trips and spending, with the average grocery bill rising by 76% in Spring 2020.
After that surge in spending, grocery trips dropped in summer months, and consumers spent 40% less with each grocery trip and tracked fewer trips than pre-pandemic.
Offline Food Spending Looked a Lot Different Last Year
COVID changed offline food spending beyond its impact to sit-down restaurants. Our spend data shows that Fast Food receipt tracking grew by 83% year over year. And what about picking up groceries? Although there was an initial surge in grocery trips during lockdowns last year, consumers tracked 20% fewer grocery trips over the summer months, as restrictions eased.
% of Food Receipts from Fast Food
% of Food Receipts from Grocery
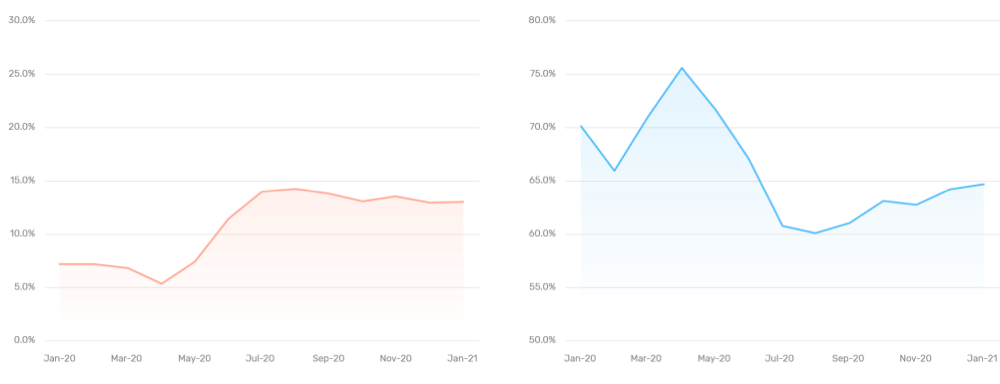
Source: Sensibill Data Lab
Consumers Aren’t Just Grocery Shopping Less, They’re Spending Less, Too
Consumers aren’t just buying groceries at grocery stores; they’re buying groceries at general retailers like Costco and Walmart. Our spend data looks at what they’re buying, not just where, and shows the average grocery bill surged by 76% during Wave 1, but then plummeted below pre-COVID levels. Not only are consumers buying groceries less often, they’re spending 40% less with each grocery trip than they did in 2019.
Grocery Spend per Trip

Source: Sensibill Data Lab